See your intelligence layer. Then govern it.
Canvas is the visual map of your metrics, entities and data sources - built collaboratively in workshops with your team, versioned in your Git repository, fed into SEAM Runtime so your agents can resolve through it.
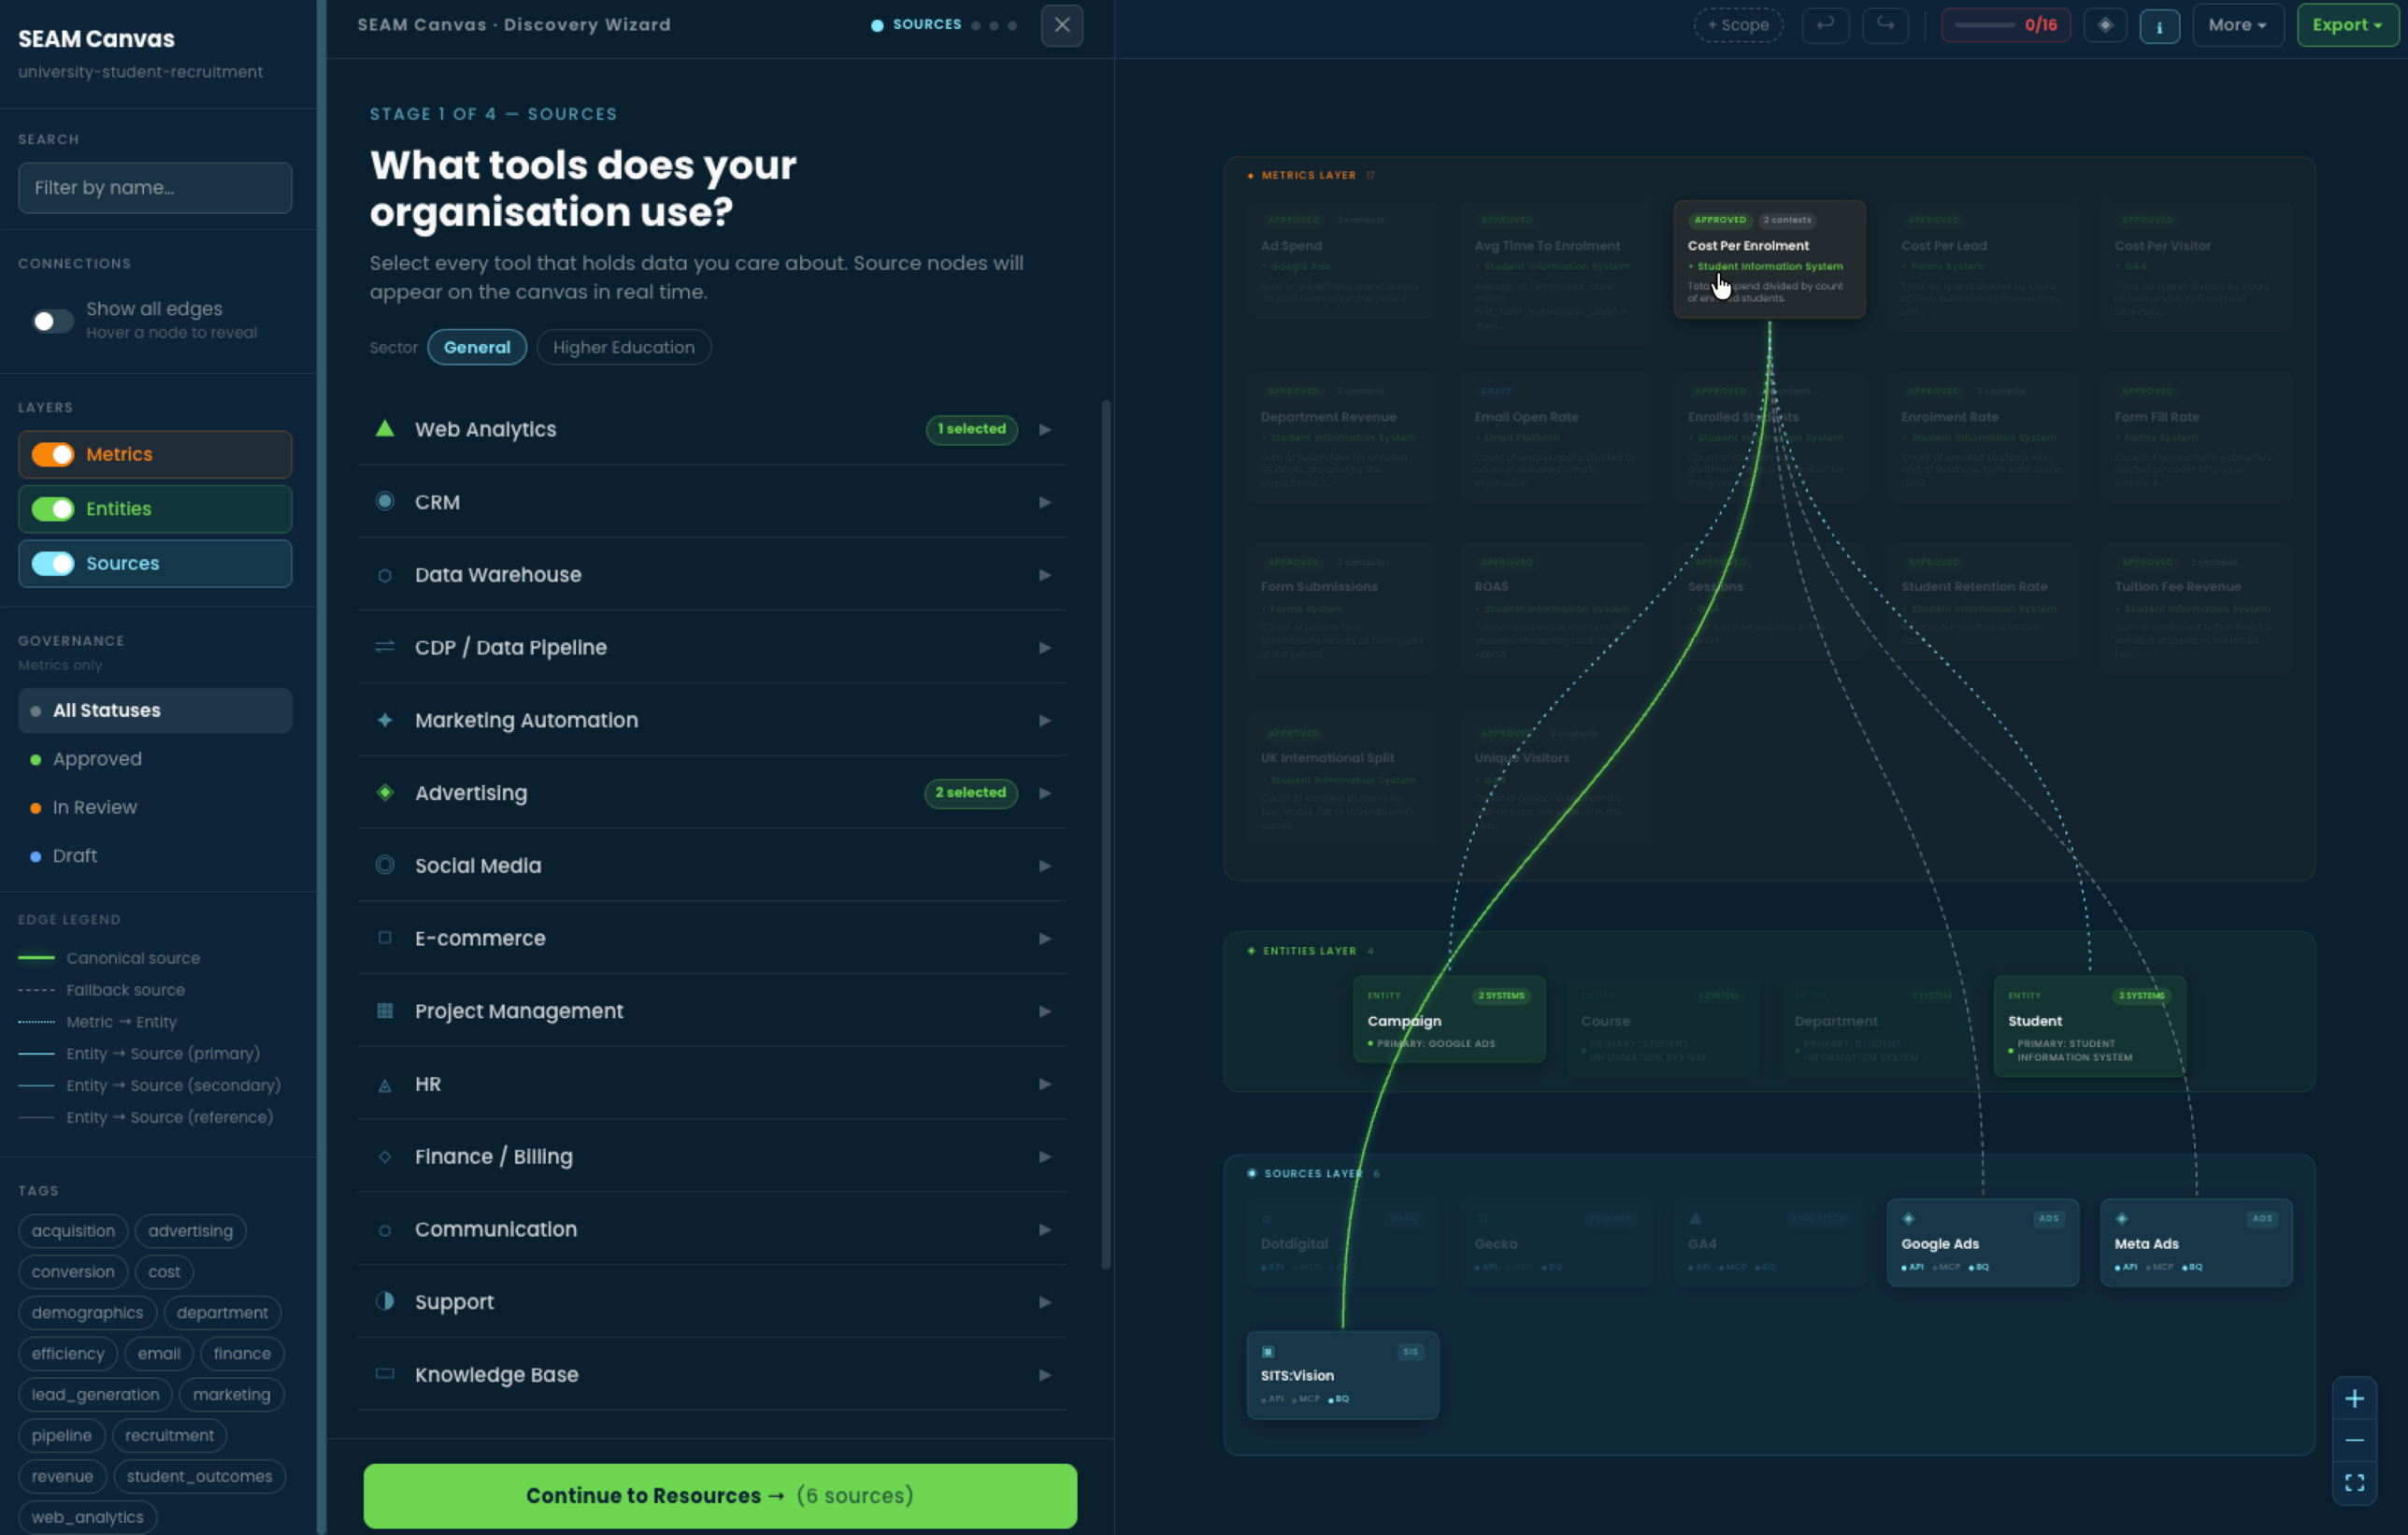
Canvas in use on a university student recruitment model. The Discovery Wizard (centre) is partway through a Stage 1 sources audit, asking which tools the organisation uses. The canvas itself (right) shows 17 metrics, 4 entities and 6 data sources, with dashed and solid edges drawing the lineage between them. The left sidebar controls which layers and statuses are visible; tags at the bottom filter by business domain.
Canvas is the artefact a workshop produces.
We don't show up with definitions ready-made. We sit down with the people who know the business - analysts, finance leads, ops managers, marketers - and build the map with them. Canvas is the surface we work on. By the end of a workshop, the map exists, lives in your Git repository and is the starting point for everything else SEAM does.
Discover
The Discovery Wizard walks the room through the systems your organisation actually runs on. Each tool gets named, owned and added to the canvas as a data source.
Define
Metrics and entities come out of the conversation in the room. Conflicting definitions get surfaced, owners get named, the canonical source gets agreed. Disagreement becomes recorded fact, not unspoken friction.
Deploy
Canvas writes the YAML. The map gets compiled into a SEAM manifest. Your agents start resolving against it. The artefact your team built in the room is the artefact your agents reason against in production.
Definitions, owners, sources, gaps. All explicit. All in one place.
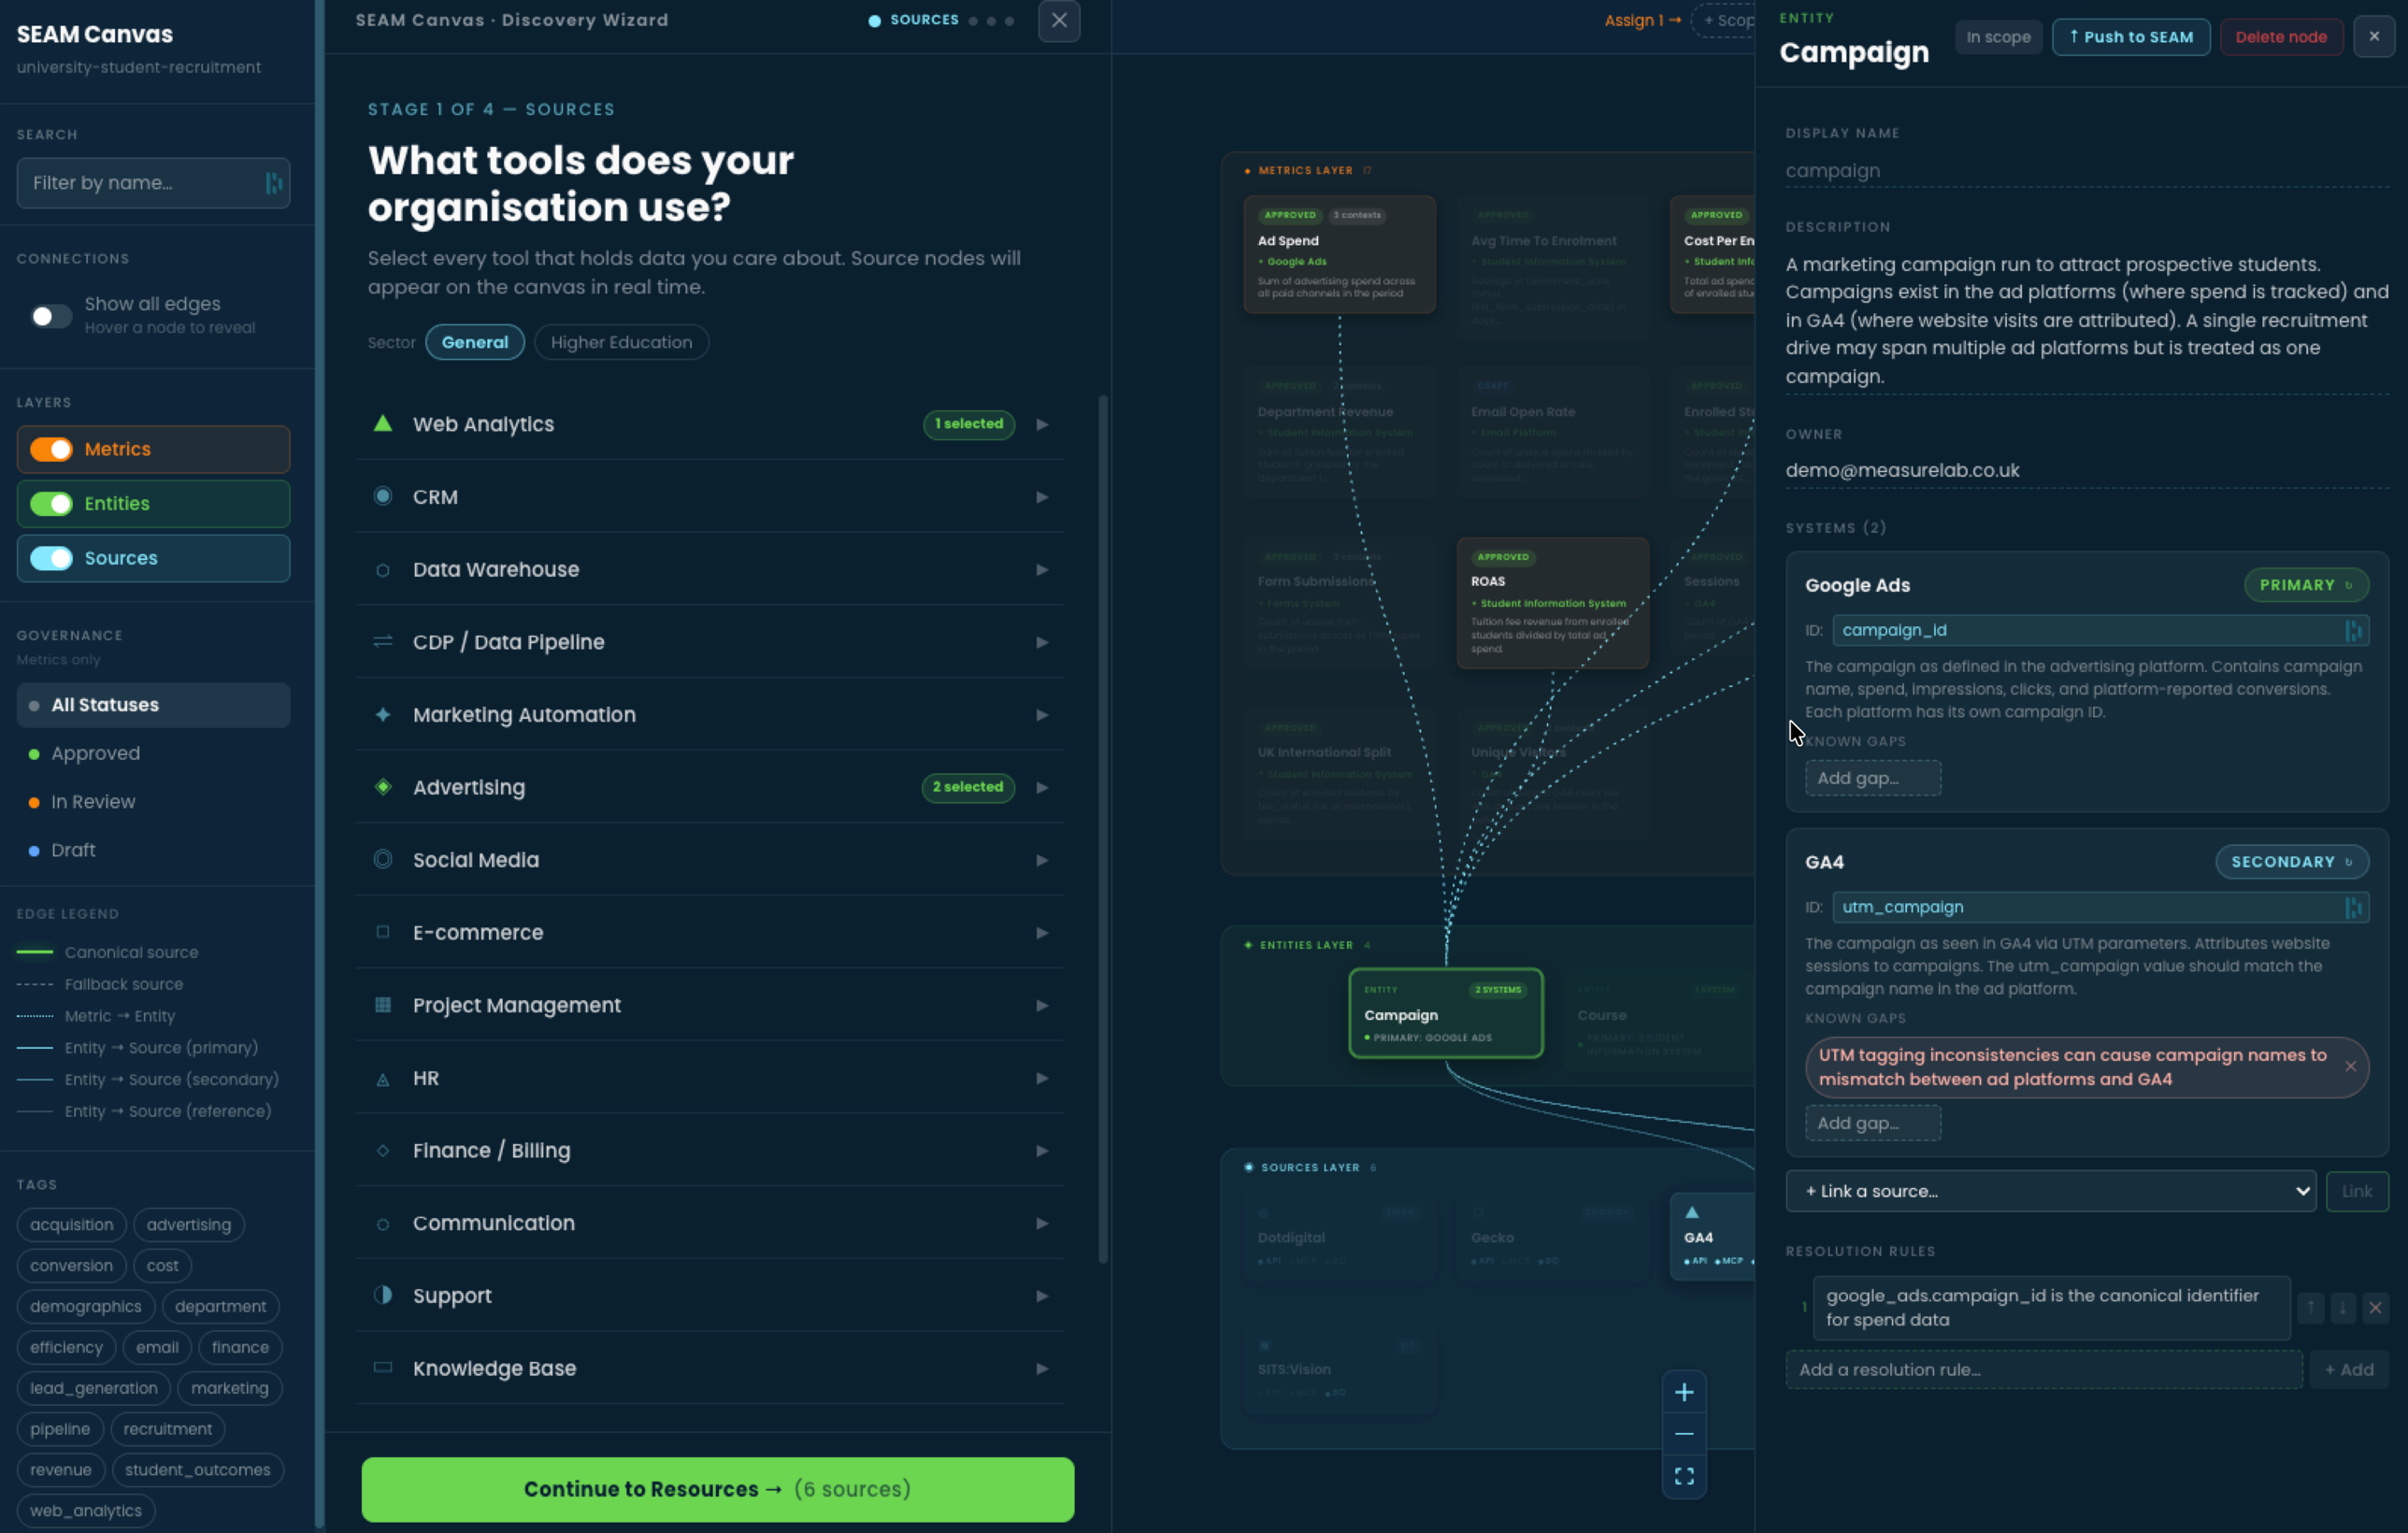
The Campaign entity panel. Two systems hold campaign data - Google Ads (primary, using campaign_id) and GA4 (secondary, using utm_campaign). Both systems are captured in one governed entity. Known gaps are recorded explicitly: here, UTM tagging inconsistencies between ad platforms and GA4. Resolution rules say which identifier wins for which question.
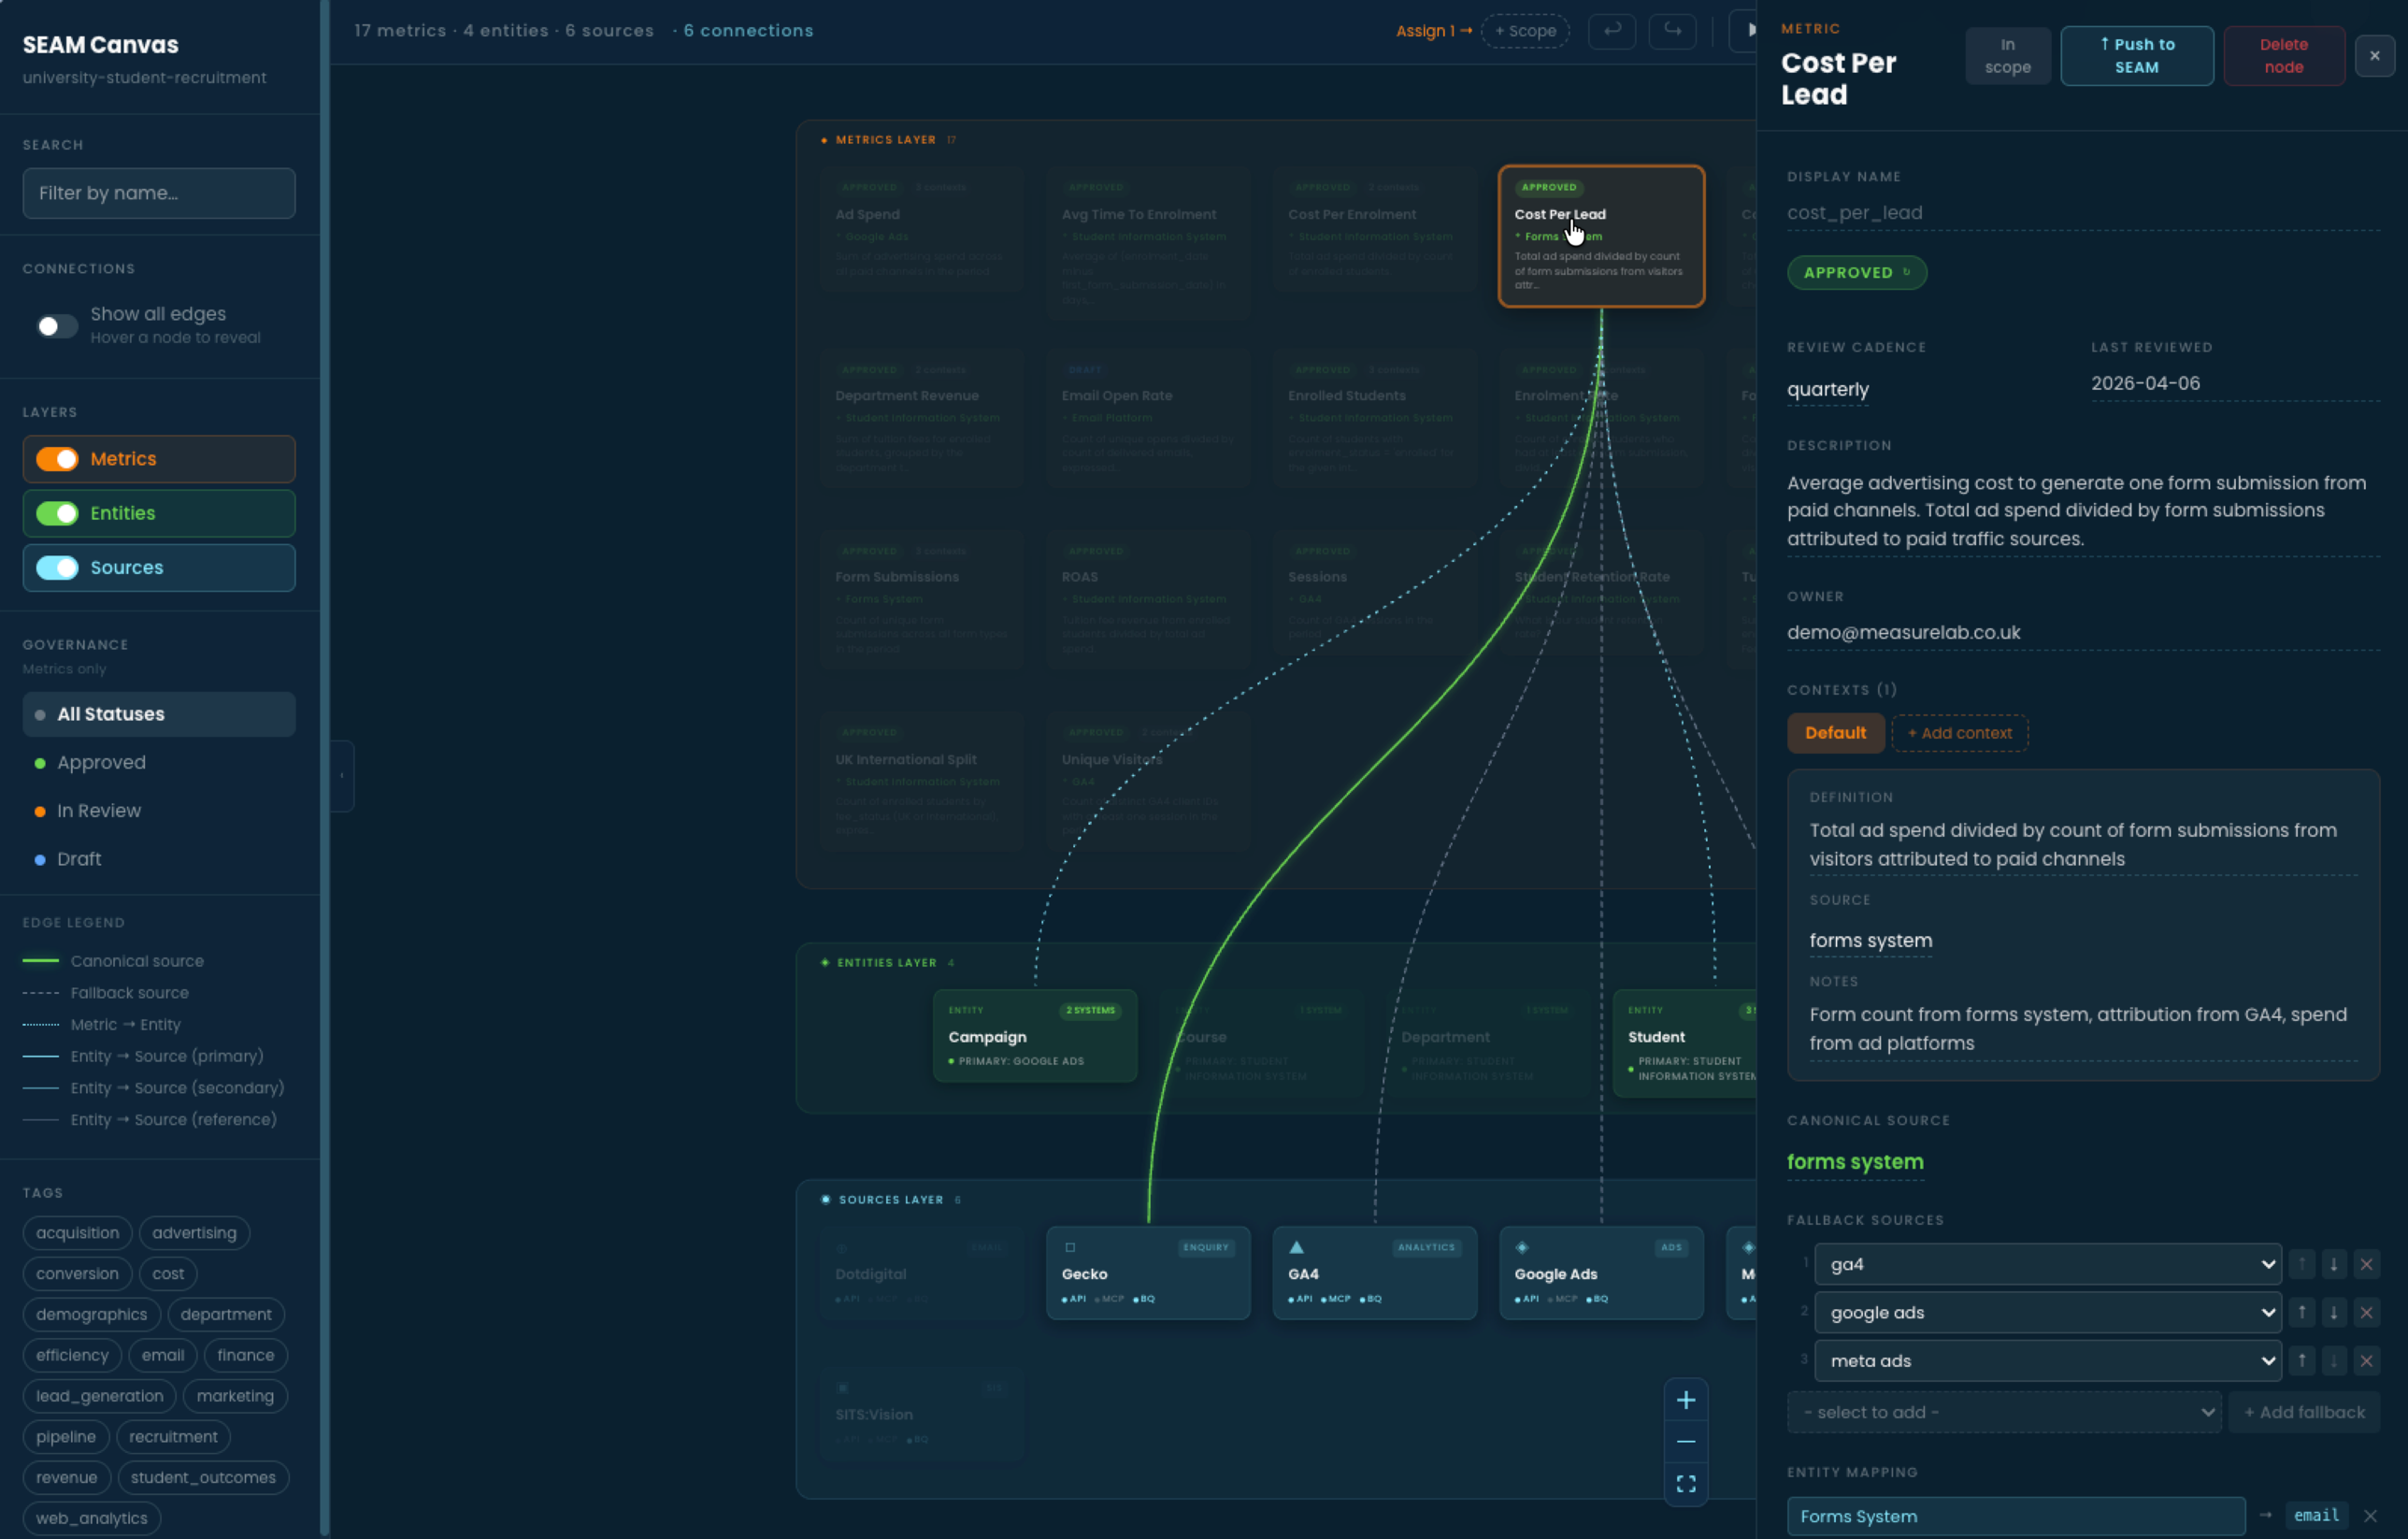
The Cost Per Lead metric panel. Every governed metric carries its definition, its owner, its review cadence, its canonical source and an ordered list of fallback sources for when the canonical one fails. Here, the forms system is canonical; GA4, Google Ads and Meta Ads are fallbacks in priority order. Definitions are reviewed regularly and timestamped.
Build it visually. Or write the YAML directly.
Canvas is built for the workshop - the rooms where the people who know the business meet the people who know the data. For engineering teams that prefer to author definitions in code, the same SEAM YAML schema is editable in any text editor, validated by the SEAM CLI in the terminal and reviewed in pull requests like any other infrastructure-as-code. Both paths produce the same governed output. Both feed the same Runtime.
Canvas (visual)
Workshops, stakeholder interviews, mixed-discipline rooms. Best when the definitions need to come out of people, not code. Output: governed YAML, the same shape as the IDE path.
In code
YAML in your editor of choice, validated via the seam CLI in the terminal, versioned in Git, reviewed in pull requests. Best when your data team already lives in dbt or Dataform.
Run a workshop on your own data.
Canvas comes alive in the room with real data. The fastest way to see it on your stack is a discovery call - we walk through what you're trying to govern and whether the workshop format fits.